A sponsor rarely asks which algorithm wins. The question is more likely: which customers should we approach when only part of the available pool can be contacted? A model comparison translates that question into selections that can be evaluated. The historical comparison from Corvendor's work shows why both the ranking and the available effort matter.
Define the purpose of selection first
One campaign may aim to concentrate as much expected sales pipeline as possible within a limited number of contacts. Another may aim to reach a broader customer group regularly. Both goals can be useful, but they do not necessarily lead to the same selection. Pipeline represents potential sales opportunities, not revenue already earned.
The comparison needs a defined target population, eligible contacts, and intended outcome. In the historical example shown, each contact attempt had the same assigned cost, so the number of attempts was proportional to cost. If contacts require different amounts of effort, their actual costs would need to be considered instead.
Evaluate methods under comparable conditions
The historical comparison used different customer accounts for evaluation than for model training. That distinction matters: a method should provide a useful selection for cases not used in training, rather than simply reproduce familiar examples.
For a new project, we agree on four foundations with the team:
- The same task: Compare methods against the same available customer pool, contact constraints, and outcome definition.
- Suitable evaluation data: Separate training, tuning, and final evaluation appropriately, accounting for recurring customers and changes over time when dividing the data.
- Simple baselines: Alongside models, examine what a transparent business rule or the existing approach achieves.
- The relevant scope: Pay particular attention to the portion of the selection that the available budget can actually reach.
These points describe an approach to a sound new comparison. Confirmation of separate customer accounts does not, by itself, document every detail of the historical training and evaluation procedure.
How to read the historical chart
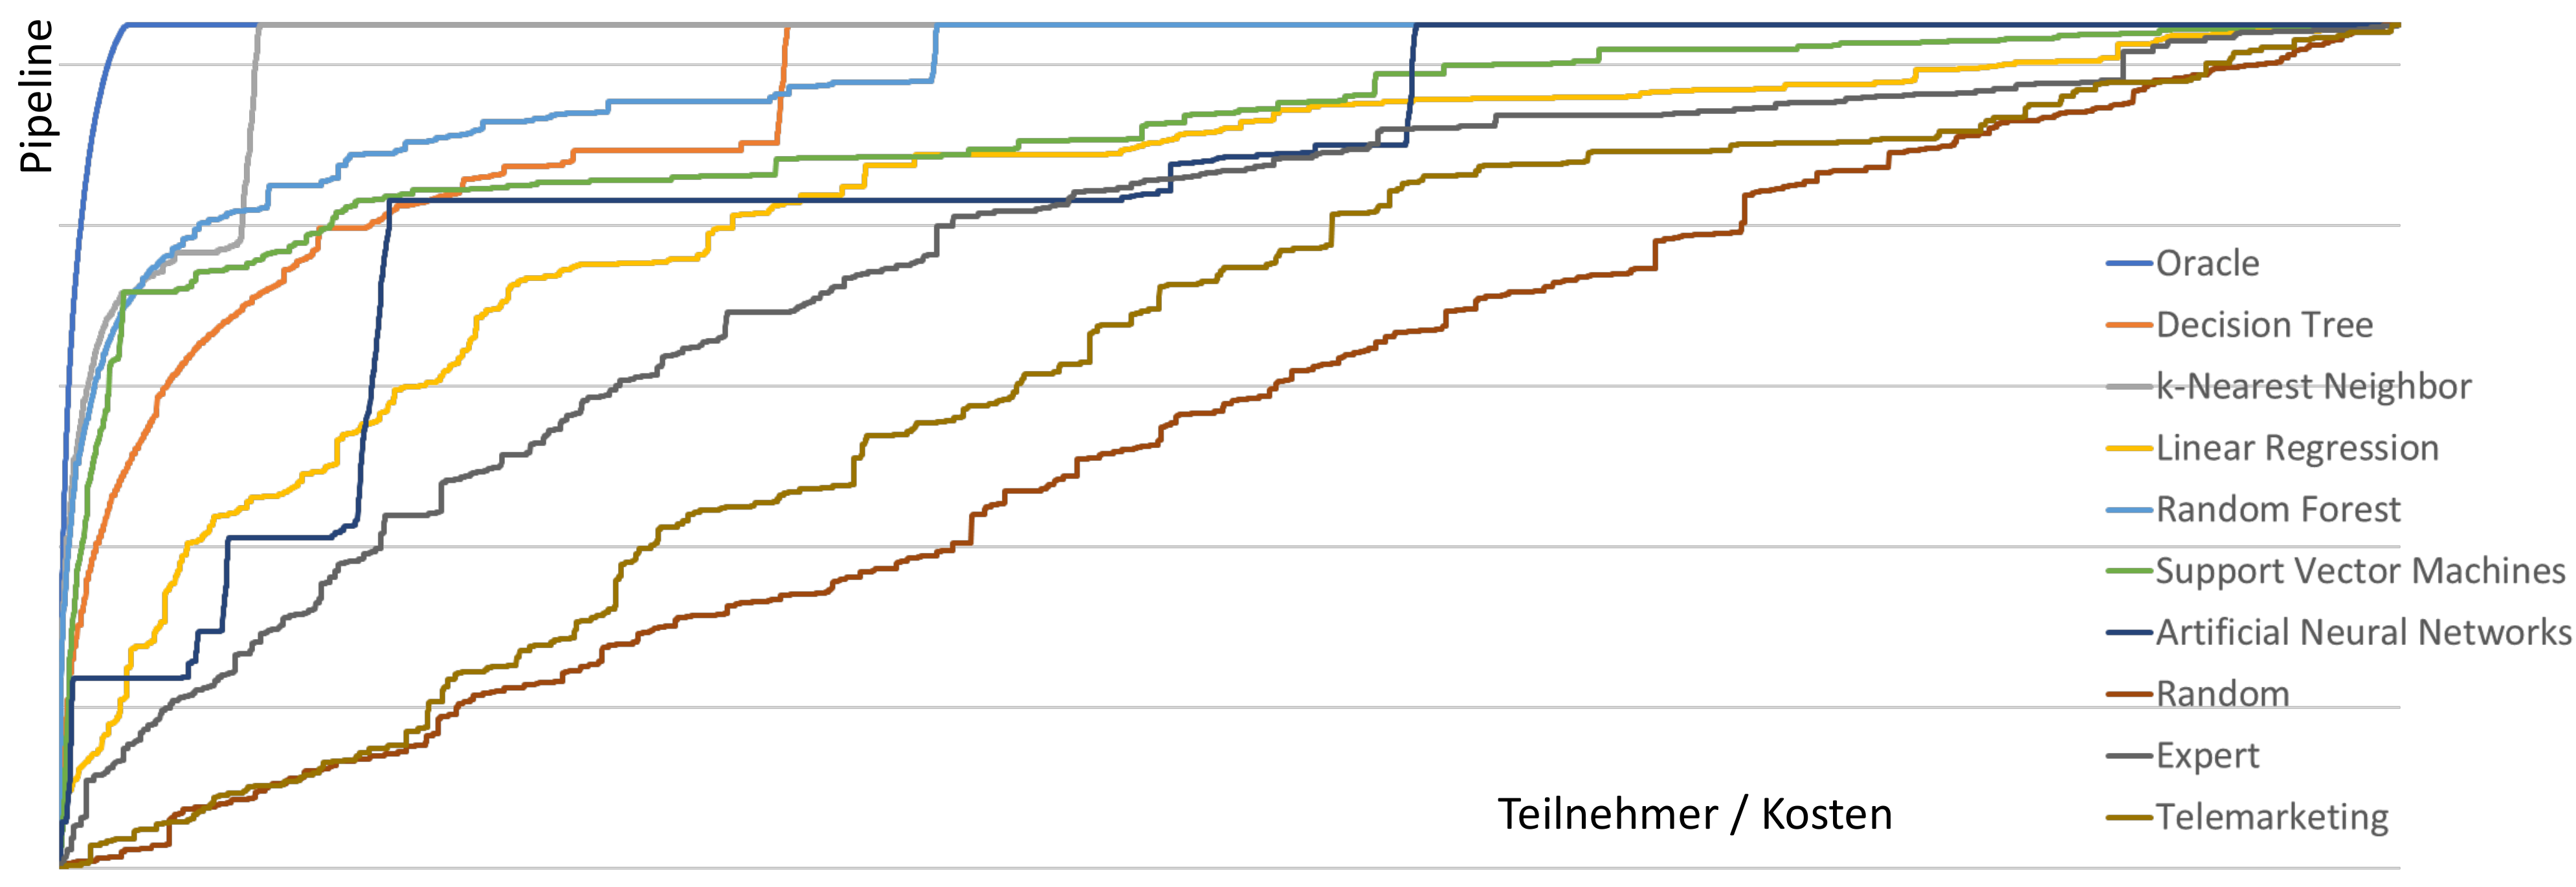
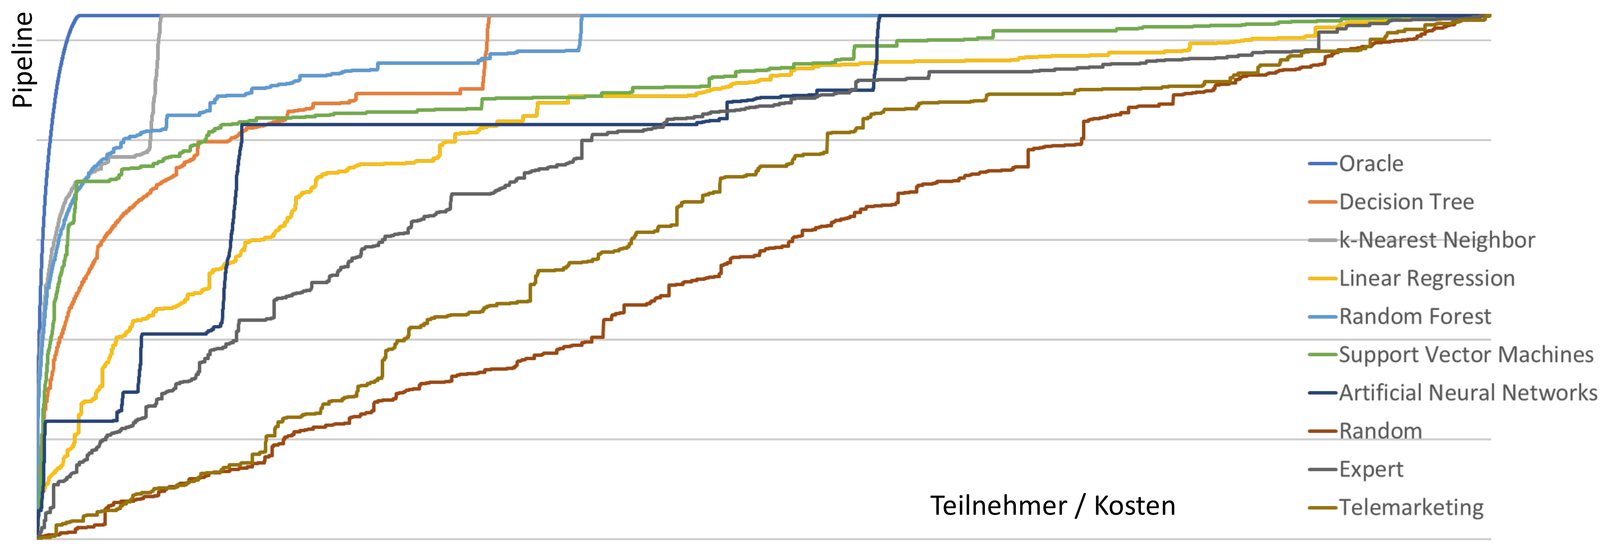
The chart comes from a Corvendor presentation in 2019. Moving from left to right increases the number of contact attempts. Moving upward accumulates the actual pipeline subsequently recorded for the evaluation accounts. The methods order the accounts differently; a curve that rises sharply early concentrates more of that pipeline near the front of its selection.
“Oracle” means the best ordering in hindsight, with the subsequent outcomes already known. It is a benchmark, not a deployable prediction model. “Expert” was a weighted calculation using selected features; it should not be confused with the separately displayed “Linear Regression” model. “Telemarketing” remains the historical reference label; its precise selection rule has not been reconstructed for this article.
In this comparison, the k-Nearest Neighbor curve rises strongly early on. The relative order of other methods changes farther along the chart. This makes the planned contact volume important. A strong position in this historical evaluation does not establish that a method is the best choice for every new customer group and budget.
The chart has no numerical axis values. No percentage improvement or specific cost saving is therefore inferred from it. The enlarged original excerpt preserves the historical curves; it is not a retrospectively recomputed analysis.
Good selection is different from an accurate forecast
A method can concentrate considerable pipeline early in its ranking while still estimating the expected amounts for individual accounts inaccurately. Ranking quality and the accuracy of predicted amounts are separate questions. A few exceptionally large opportunities can also change a curve substantially and deserve separate examination.
Accumulated pipeline likewise does not show which additional portion was caused by making contact. That would require a suitable comparison of contacted and uncontacted groups. The displayed model comparison is neither a guarantee of a future campaign outcome nor proof of causal incremental benefit.
Turn the comparison into a useful decision
For the sponsor, the result is a reasoned recommendation for the upcoming selection. It includes the appropriate method, usable data, limits of the result, and work required to keep it operating. Where methods perform similarly, interpretability, maintenance effort, and robustness may decide between them.
Domain experts contribute the objectives, business exceptions, and meaning of the inputs. Corvendor can connect data preparation, model comparison, and integration into the workflow. The work then ends with more than a curve: it produces a selection whose basis the team can understand and continue evaluating.
Begin with a bounded selection and keep learning
A pilot can focus on one campaign type and an agreed contact volume. Before use, the team defines how recommendations will be adopted, exceptions handled, and outcomes fed back. A comparable baseline helps assess the value of the new selection.
- Outcomes: Which qualified opportunities and pipeline emerge over the agreed period, and how do expectations differ from observations?
- Stability: Does the method hold up across further periods or customer groups, or does the result depend heavily on a few outliers?
- Work required: Can data maintenance, selection, and domain review be repeated at a reasonable cost?
These checks are steps for a new deployment, not additional measurements established for the historical chart. Feedback from use helps determine whether to retain the method, adjust it, or replace it with a simpler solution.
A useful model comparison answers a business question: which selection fits our goal and available effort? What matters is a reasoned decision that can be evaluated in daily work, not just the most striking curve.